Download presentation
Presentation is loading. Please wait.

1
構造的表現 Structure and Space

2
似ている 似ていない Alike, not alike

3
実数直線 (Real) number line
 number line")
4
2項目で距離を定める

5
k項目で距離を定める

6
距離 Distance L(A,B) L(A,B)>=0 L(A,B) = L(B,A) L(A,A) = 0
A value is defined between two items, A and B L(A,B)>=0 L(A,B) = L(B,A) L(A,A) = 0 L(A,B) <= L(A,C) + L(B,C) 三角不等式 Triangle inequality
>=0. L(A,B) = L(B,A) L(A,A) = 0. L(A,B) <= L(A,C) + L(B,C) 三角不等式 Triangle inequality.")
7
三角不等式 Triangle inequality
次を解け Solve a=y+z; b=z+x; c=x+y.

8
ペアワイズ Pair-wise L(A,B) N*(N-1)/2 2つのものA,Bの間に定められる量
A value is defined between two items, A and B N*(N-1)/2
/2.")
9
近隣結合法 Neighbor-Joining method
三角不等式を用いて木を描く Draw a tree using triangle inequality

10
NJ法 NJ method #サンプル数Ns=5が5次元のデータを持っているようなデータセットを作成
R4-2.R #サンプル数Ns=5が5次元のデータを持っているようなデータセットを作成 Ns<-5;k<-5;x <- matrix(rnorm(Ns*k), nrow=Ns) dist(x,method="euclidean") # ユークリッド距離の距離行列 library(ape) # 木を作る関数nj()を持つパッケージapeの読み込み treu<-nj(dist(x,method="euclidean")) # apeの近隣結合法関数njにより木を作る par(mfcol=c(2,3)) plot(treu) # 木の表示 plot(treu, type="p") plot(treu, "c") plot(treu, "f") plot(treu, "u") plot(treu, "r") # type "phylogram”, "cladogram", "fan", "unrooted", "radial"
, nrow=Ns) dist(x,method= euclidean ) # ユークリッド距離の距離行列. library(ape) # 木を作る関数nj()を持つパッケージapeの読み込み. treu<-nj(dist(x,method= euclidean )) # apeの近隣結合法関数njにより木を作る. par(mfcol=c(2,3)) plot(treu) # 木の表示. plot(treu, type= p ) plot(treu, c ) plot(treu, f ) plot(treu, u ) plot(treu, r ) # type phylogram , cladogram , fan , unrooted , radial")
11
距離のとりかたを変える Different “distance-definitions”
treu<-nj(dist(x,method="euclidean")) # apeの近隣結合法関数njにより木を作る trman<-nj(dist(x,method="manhattan")) # マンハッタン距離で木を作る par(mfcol=c(1,2)) # 画面を1行2列に分割 plot(treu);plot(trman) # 2つの距離法で木の表示 par(mfcol=c(1,1)) # 画面分割を1行1列に戻す
) # apeの近隣結合法関数njにより木を作る. trman<-nj(dist(x,method= manhattan )) # マンハッタン距離で木を作る. par(mfcol=c(1,2)) # 画面を1行2列に分割. plot(treu);plot(trman) # 2つの距離法で木の表示. par(mfcol=c(1,1)) # 画面分割を1行1列に戻す.")
12
別のやり方で木を作る Different methods to generate trees
R5-1.R 階層的クラスタリング法 Hierarchical clustering methods

13
距離行列の2軸 Two axes in distance matrix

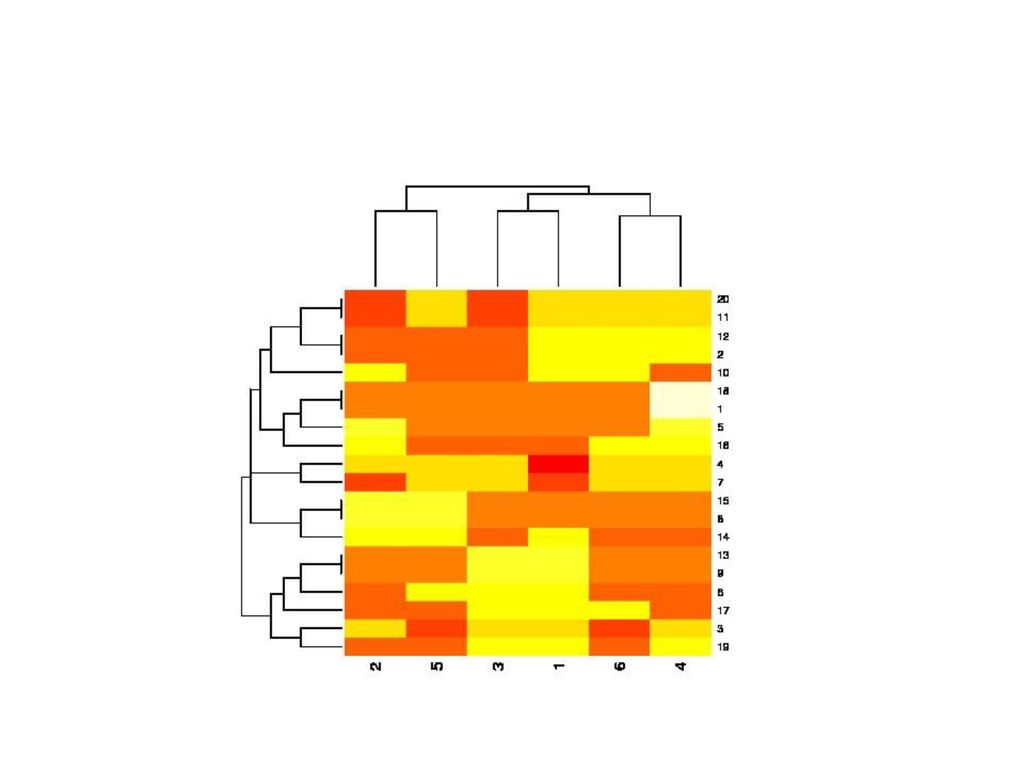
14
行の順序をそのままに The order of rows as they are LD-plot
R5-2.R R5-3.R m<-matrix(rbinom(120,1,0.5),20,6) heatmap(m) cormatrix<-cor(m);rsqmatrix<-cormatrix^2 image(1:nrow(rsqmatrix),1:ncol(rsqmatrix),rsqmatrix,col=gray((100:0)/100))
,20,6) heatmap(m) cormatrix<-cor(m);rsqmatrix<-cormatrix^2. image(1:nrow(rsqmatrix),1:ncol(rsqmatrix),rsqmatrix,col=gray((100:0)/100))")
16
距離 角度 余弦 Distance Angle Cosine

17
ペアワイズ Pair-wise L(A,B) N*(N-1)/2 2つのものA,Bの間に定められる量
A value is defined between two items, A and B N*(N-1)/2
/2.")
18
ペアワイズでない比較 Non-pairwise comparison
3要素の比較 Three items to be compared ABC 0 0 0 N1 0 0 1 N2 0 1 0 N3 0 1 1 N4 1 0 0 N5 1 0 1 N6 1 1 0 N7 1 1 1 N8 AB 0 0 N1+N2 0 1 N3+N4 1 0 N5+N6 1 1 N7+N8 BC 0 0 N1+N5 0 1 N2+N6 1 0 N3+N7 1 1 N4+N8 CA 0 0 N1+N3 0 1 N2+N4 1 0 N5+N7 1 1 N6+N8

19
ペアワイズでない比較 Non-pairwise comparison
3要素の比較 Three items to be compared ABC 0 0 0 0.125 0 0 1 0 1 0 0 1 1 1 0 0 1 0 1 1 1 0 1 1 1 ABC 0 0 0 0.25 0 0 1 0 1 0 0 1 1 0. 25 1 0 0 1 0 1 1 1 0 1 1 1 AB 0 0 0.25 0 1 1 0 1 1 BC 0 0 0.25 0 1 1 0 1 1 CA 0 0 0.25 0 1 1 0 1 1

20
関係はいくつある How many “RELATIONS”?

21
非階層的クラスタリング法 NON -hierarchical clustering methods
R6-2.R 非階層的クラスタリング法 NON -hierarchical clustering methods R6-3.R

22
R6-2.R R6-3.R # 正規乱数を用いてデータを作る n1<-500;n2<-300;n3<-200;x<-c(rnorm(n1,0,0.5),rnorm(n2,5,1),rnorm(n3,8,2));y<-c(rnorm(n1,0,2),rnorm(n2,3,2),rnorm(n3,-3,1)) library(gregmisc) # hist2d()を持つパッケージ h2d <- hist2d(x,y, show=FALSE,same.scale=TRUE, nbins=c(10,10)) # 2次元ヒストグラム情報を取る plot(x,y) # 散布図 filled.contour( h2d$x, h2d$y, h2d$counts, nlevels=9,col=gray((8:0)/8) ) # 2次元ヒストグラムを濃淡で persp( h2d$x, h2d$y, h2d$counts,ticktype="detailed", theta=60, phi=30,shade=0.5, col="cyan") # 2次元ヒストグラムを鳥瞰図で # 非階層的クラスタリング m3<-matrix(c(x,y),ncol=2) cl <- kmeans(m3, 3) # kmeans法で3群にクラスタリング plot(m3, col = cl$cluster) points(cl$centers,pch = 8, cex=10) # クラスタの中央に印をつける
,rnorm(n2,5,1),rnorm(n3,8,2));y<-c(rnorm(n1,0,2),rnorm(n2,3,2),rnorm(n3,-3,1)) library(gregmisc) # hist2d()を持つパッケージ. h2d <- hist2d(x,y, show=FALSE,same.scale=TRUE, nbins=c(10,10)) # 2次元ヒストグラム情報を取る. plot(x,y) # 散布図. filled.contour( h2d$x, h2d$y, h2d$counts, nlevels=9,col=gray((8:0)/8) ) # 2次元ヒストグラムを濃淡で. persp( h2d$x, h2d$y, h2d$counts,ticktype= detailed , theta=60, phi=30,shade=0.5, col= cyan ) # 2次元ヒストグラムを鳥瞰図で. # 非階層的クラスタリング. m3<-matrix(c(x,y),ncol=2) cl <- kmeans(m3, 3) # kmeans法で3群にクラスタリング. plot(m3, col = cl$cluster) points(cl$centers,pch = 8, cex=10) # クラスタの中央に印をつける.")
Similar presentations


 どこで だれの 考え方9W4H(Ver.0) いつ から>")


>")


