Download presentation
Presentation is loading. Please wait.

3
著者:外岡秀行

4
著者:外岡秀行

5
著者:新井康平

6
著者:新井康平

7
著者:新井康平

8
著者:新井康平

9
著者:森山雅雄(外岡修正)
")
10
著者:森山雅雄(外岡修正)
")
11
著者:浦井稔

12
著者:浦井稔

13
下記の文献を一部改 Iwasaki, A. , and H
下記の文献を一部改 Iwasaki, A., and H. Tonooka: Validation of a crosstalk correction algorithm for ASTER/SWIR, IEEE Transactions on Geoscience and Remote Sensing, 43(12), pp , Fig. 3(a), 著者:浦井稔
, pp , Fig. 3(a), 著者:浦井稔.")
14
著者:外岡秀行

15
著者:外岡秀行

16
著者:新井康平

17
著者:新井康平

18
著者:新井康平

20
著者:森山雅雄

21
著者:森山雅雄

22
著者:森山雅雄

23
著者:森山雅雄

24
著者:森山雅雄

25
著者:森山雅雄

26
著者:森山雅雄

27
著者:中島孝

28
著者:中島孝

32
Chapter 9 Radiometric Correction and Cloud Detection

33
Typical onboard calibration system of visible to shortwave infrared

34
Example of the observed and estimated smooth curve of atmospheric optical thickness

35
Typical configuration of a thermal infrared remote sensor

36
Schematic of temperature based vicarious calibration

37
Types of noise remaining after the radiometric correction
(a): A set of stripe noise in a PRISM image observed near the Kasumigaura Bridge, Ibaraki, Japan, on December 28, 2006. (b): A line of missing data in an ASTER TIR image near Gunma and Nagano prefectures, Japan, on March, 9, 2005. (c): Smear and blooming in an ASTER VNIR image near Futtsu, Chiba, Japan, on December 8, 2005.
: A set of stripe noise in a PRISM image observed near the Kasumigaura Bridge, Ibaraki, Japan, on December 28, (b): A line of missing data in an ASTER TIR image near Gunma and Nagano prefectures, Japan, on March, 9, (c): Smear and blooming in an ASTER VNIR image near Futtsu, Chiba, Japan, on December 8,")
38
Crosstalk mechanism and its correction

39
Surface radiance rate as a function of wavelength, calculated for desert, vegetation, and ocean at the surface temperature of 300K under the mid-latitude summer atmospheric model using the radiative transfer code, MODTRAN 5.2.

40
Monthly mean atmospheric veritical profile of temperature and water vapor mixing ratio (Figure 9.8)
(February and August of the year 2000 at 30 to 40 degree north latitude)
")
41
Nadir transmittance, path radiance,and downward irradiance computed from the model atmosphere of Figure 9.8 using MODTRAN 3.7 Downward irradiance Nadir transmittance Path radiance

42
Cloud detection tests for visible-infrared multispectral imaging sensors
(*)NDVI: Normalized difference vegetation index, X: Executable −: Un-executable
NDVI: Normalized difference vegetation index, X: Executable −: Un-executable.")
43
A cascade structure algorithm
A parallel structure algorithm A cascade structure algorithm

44
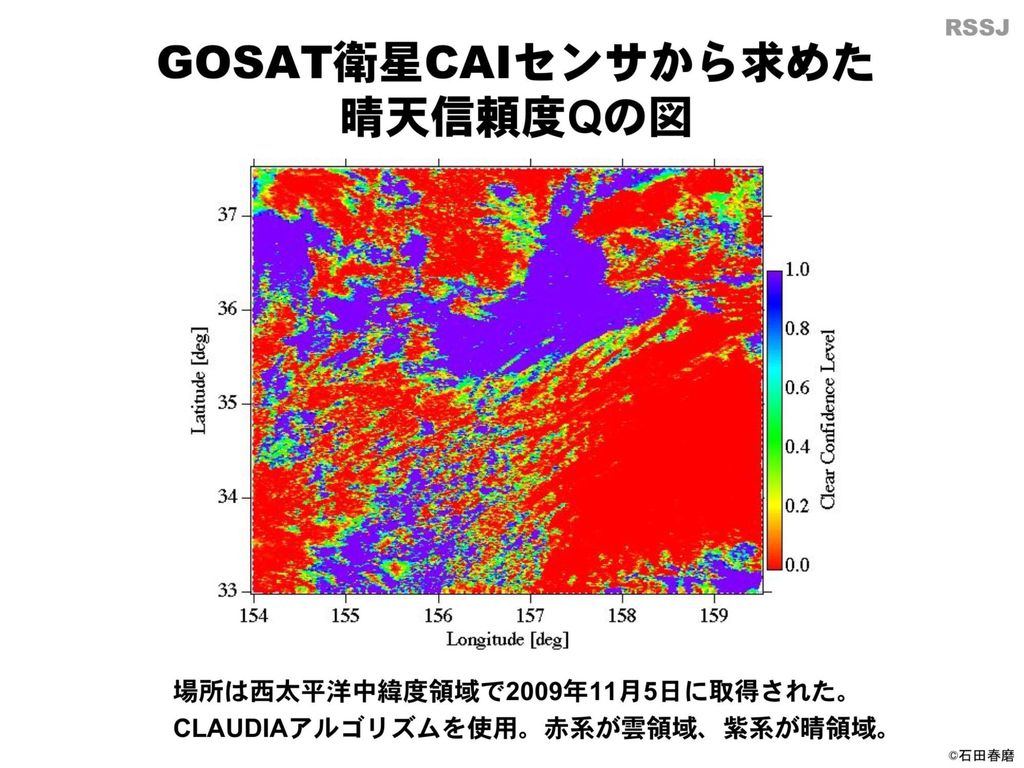
Clear Confidence Level (CCL) Q values obtained by CAI imager aboard the GOSAT over western Pacific Ocean in middle latitude (Nov. 5, 2009). Red and blue pixels denote cloudy and clear, respectively.
. Red and blue pixels denote cloudy and clear, respectively..")
45
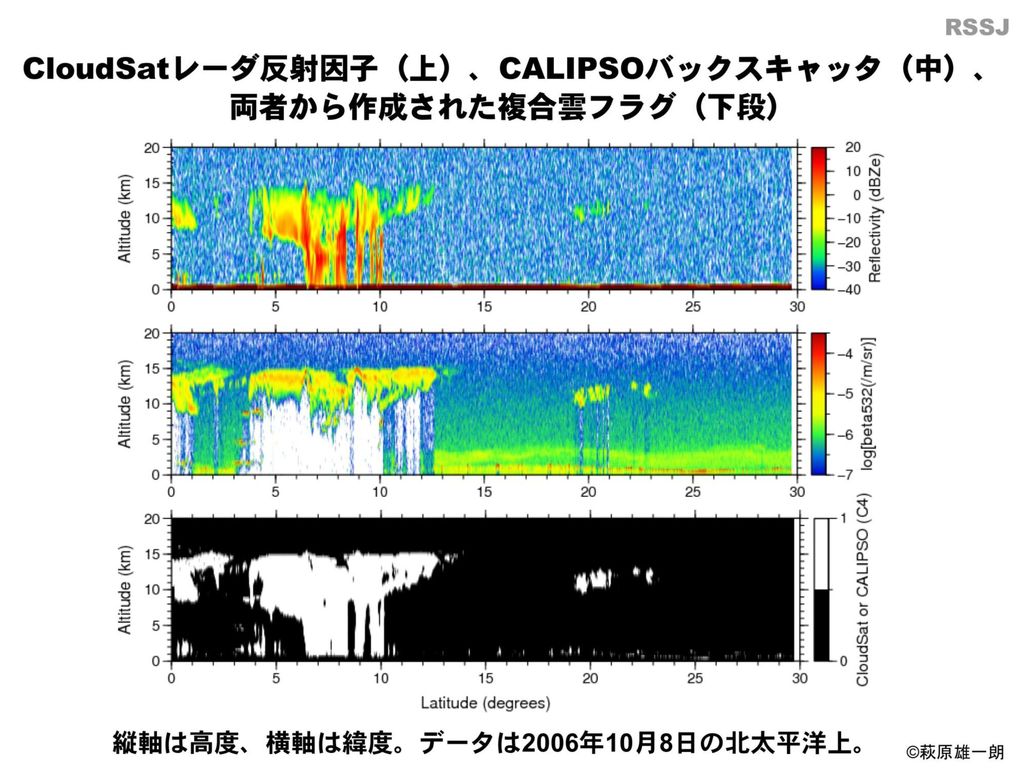
CloudSat radar reflectivity (top), CALIPSO Lidar backscatter (middle), and Cloud screening result obtained by combining radar and Lidar signals (bottom). Vertical and horizontal axes are altitude (km) and longitude (degrees), respectively. Data were acquired over the North Pacific Ocean on Oct. 8, 2006.
 and longitude (degrees), respectively. Data were acquired over the North Pacific Ocean on Oct. 8,")
Similar presentations
 simulates the climatological state of the.>")
>")


 ・たてがき / 縦書き (from right to.>")
 の生成過程 ≅ 高エネルギーイオンの寿命 ) さこ隆志(名大 STE 研) 基本的に R.J.Murphy, et al., ApJ Suppl,, 168, 167-194, 2007 の前半部分の review をします 1 太陽ガンマ線ミニ研究会@名古屋大.>")


>")


>")
