Download presentation
1
東京ベイ浦安市川医療センター 集中治療科 フェロー
川口 剛史 聖マリアンナ医科大学 救急医学 助教 東京ベイ浦安市川医療センター 集中治療科 フェロー 2015年7月21日

2
各ガイドラインの比較 ガイドライン 米国(ASPEN) ヨーロッパ(ESPEN) カナダ (CCPG) 推奨エネルギー
25-30kcal/kg/day 20-25kcal/kg/day 記載なし 投与経路 経腸栄養>経静脈栄養 経管栄養開始 24-48時間以内 24時間 以内 24-48時間 経静脈栄養開始 7日以降 2日以内 推奨しない

3
投与経路 血行動態が安定していれば経腸栄養を推奨 感染症の発症率低下 ICU滞在期間の短縮 人工呼吸器期間の短縮 カテーテル感染
外傷患者の腹腔内膿瘍 ICU滞在期間の短縮 人工呼吸器期間の短縮 ASPEN guidelines 2009 ESPEN guidelines 2009 N EngJMed 2011 EPaNIC trial

4
経腸栄養 開始時期 初期蘇生が終了し血行動態が安定次第 ICU入室後 or 発症から24-48時間以内に開始
経腸栄養 開始時期 初期蘇生が終了し血行動態が安定次第 ICU入室後 or 発症から24-48時間以内に開始 その後48-72時間かけて目標投与量へ移行 感染症の減少,在院日数の低下 死亡率の低下が期待される ASPEN 2009 guidelines Critical care Med 2001;29:2264 Intensive Care Med 2009;35:2018

5
早期栄養群(48時間以内)で 死亡率が低い 早期栄養群(24時間以内)で 死亡率が低い 重症群(APACHE≧25)ほど減少
米国多施設後ろ向きコホート 早期栄養群(48時間以内)で 死亡率が低い 重症群(APACHE≧25)ほど減少 早期栄養群で肺炎は増加 Chest 2006;129:960 Meta-analysis 早期栄養群(24時間以内)で 死亡率が低い Intensive Care Med :2018–2027
で. 死亡率が低い. 重症群(APACHE≧25)ほど減少. 早期栄養群で肺炎は増加. Chest 2006;129:960. Meta-analysis. 早期栄養群(24時間以内)で. 死亡率が低い. Intensive Care Med :2018–2027.")
6
経腸栄養の開始を遅らせない ICU入室患者の30-70%に消化管機能不全 腸蠕動音,排便を確認する必要はない 粘膜バリアの破綻
繊毛運動の変化,粘膜の萎縮 GALT(腸管関連リンパ組織)の減少 腸蠕動音,排便を確認する必要はない 蠕動音はバリア,吸収とは関係しない 確認は不要,栄養開始を遅らせない ICU入室患者,術後患者 ASPEN 2009 guidelines
の減少. 腸蠕動音,排便を確認する必要はない. 蠕動音はバリア,吸収とは関係しない. 確認は不要,栄養開始を遅らせない. ICU入室患者,術後患者. ASPEN 2009 guidelines.")
7
投与量と増量方法 25-30/kcal/kg/日 投与プロトコールを使用した方が目標投与量に達しやすい
粘膜の萎縮予防には10-30ml/hの経腸栄養で十分 ASPEN 2009 guidelines

8
投与エネルギー 1週間以内に目標量の50-65%以上を達成する ことは臨床的に有益である 特に以下の患者で目標量の50-65%が必要
熱傷,骨髄移植患者:腸管透過性亢進予防 頭部外傷患者:認知機能改善 ASPEN 2009 guidelines

9
投与量の増量方法:EDEN trial 米国での1000例の急性肺障害の患者へのRCT 少なめの量で6日間群 目標カロリーまで増量群
10ml/h(10-20kcal/h) 目標カロリーまで増量群 25ml/hで開始,増量 最初は控えめ群 どんどん増量群 JAMA, February 22/29, 2012—Vol 307, No. 8
 目標カロリーまで増量群. 25ml/hで開始,増量. 最初は控えめ群. どんどん増量群. JAMA, February 22/29, 2012—Vol 307, No. 8.")
10
投与量の増量方法:EDEN trial JAMA, February 22/29, 2012—Vol 307, No. 8

11
投与量の増量方法:EDEN trial 結果 呼吸器離脱,死亡率, 肺炎の 発生率も有意差なし どんどん増量か 最初は控えめか
どちらがいいか わかってない! JAMA, February 22/29, 2012—Vol 307, No. 8

12
経静脈栄養の開始時期 ASPEN(米国の学会) vs ESPEN (欧州の学会) ガイドライン ASPEN ESPEN 経静脈栄養 開始時期
ガイドライン ASPEN ESPEN 経静脈栄養 開始時期 経管栄養が不可能な場合 7日以降 2日以内

13
EPaNIC Trial ASPEN(米国の学会) vs ESPEN (欧州の学会)
ベルギーの7つのICUでの オープンラベルRCT 早期経静脈栄養 (ESPEN):48時間以内 vs 晩期経静脈栄養 (ASPEN):8日目から NEJM 365;6 ne august 11, 2011
:48時間以内. vs 晩期経静脈栄養 (ASPEN):8日目から. NEJM 365;6 ne august 11,")
14
EPaNIC Trial 8日目まで経静脈栄養は しない方が良い 死亡率に有意差なし 早期群で感染率,ICU滞在日数が増加
晩期群で低血糖の頻度が増加 8日目まで経静脈栄養は しない方が良い

15
これまでわかっていること Early ENは考慮に値する 初期投与量はTrophic feedingで良さそう
EPaNIC trialでは、8日目以降はSupplemental PNを 行っている 蛋白質投与量に関しては不明

16
Permissive Underfeeding or Standard Enteral Feeding in Critically Ill Adults
N Engl J Med 2015;372: Permissive Underfeeding or Standard Enteral Feeding in Critically Ill Adults N Engl J Med 2015;372:

17
PICO Patient, Intervention, Comparison, Outcome
patient, comparison, intervention, outcome

18
PICO Patient, Intervention, Comparison, Outcome
ICU患者に 経腸栄養のカロリー量を減量するのと 標準カロリーを投与するのとで 死亡率が減るかどうか patient, comparison, intervention, outcome

19
PermiT trial The Permissive Underfeeding versus Target Enteral Feeding
in Adult Critically Ill Patients

20
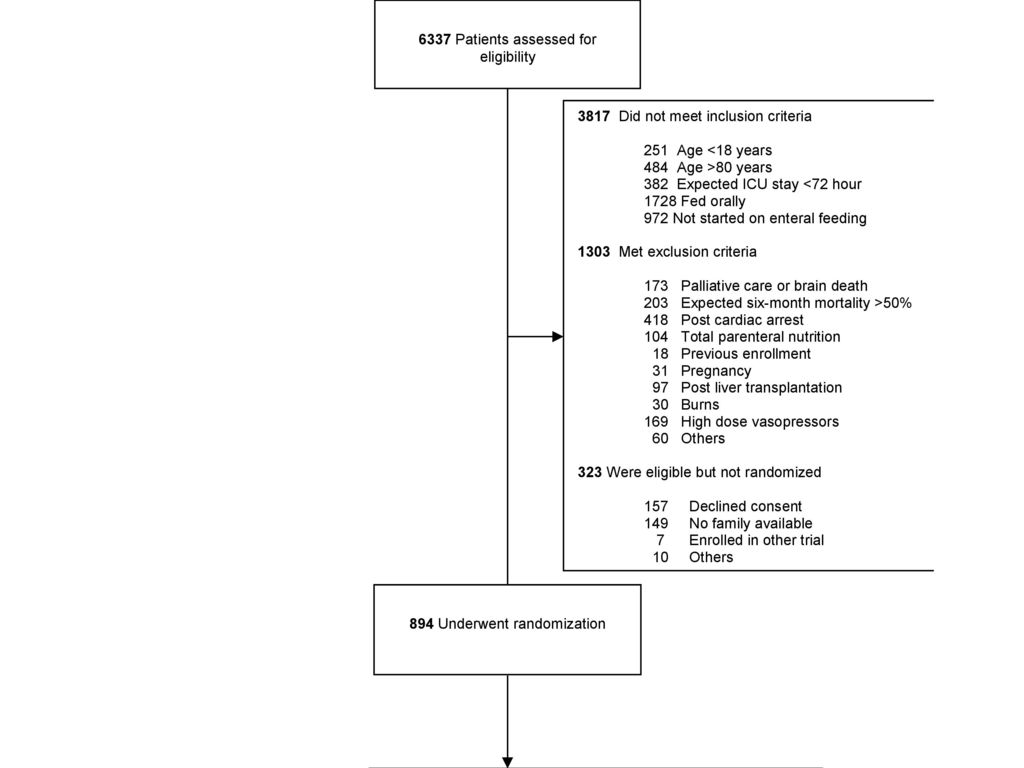
Inclusion Criteria サウジアラビアとカナダの3次医療機関7施設 2009年11月〜2014年9月 年齢18〜80歳
ICUに入室 入室後48時間以内に経腸栄養を開始可能 72時間以上ICUに滞在しそう

21
Exclusion Criteria 高濃度血管作動薬を使用している 治療の適応が乏しい 脳死 もともと6ヶ月死亡が50%以上 心肺停止後
ノルアドレナリン>0.4γ アドレナリン>0.4γ ドパミン>20γ フェニレフリン>300μg/min バゾプレシン>0.04U/min またはそれぞれの50%以上の量の併用 治療の適応が乏しい 脳死 もともと6ヶ月死亡が50%以上 心肺停止後 TPNを行った 過去に当スタディに参加した 妊婦 肝移植 熱傷

23
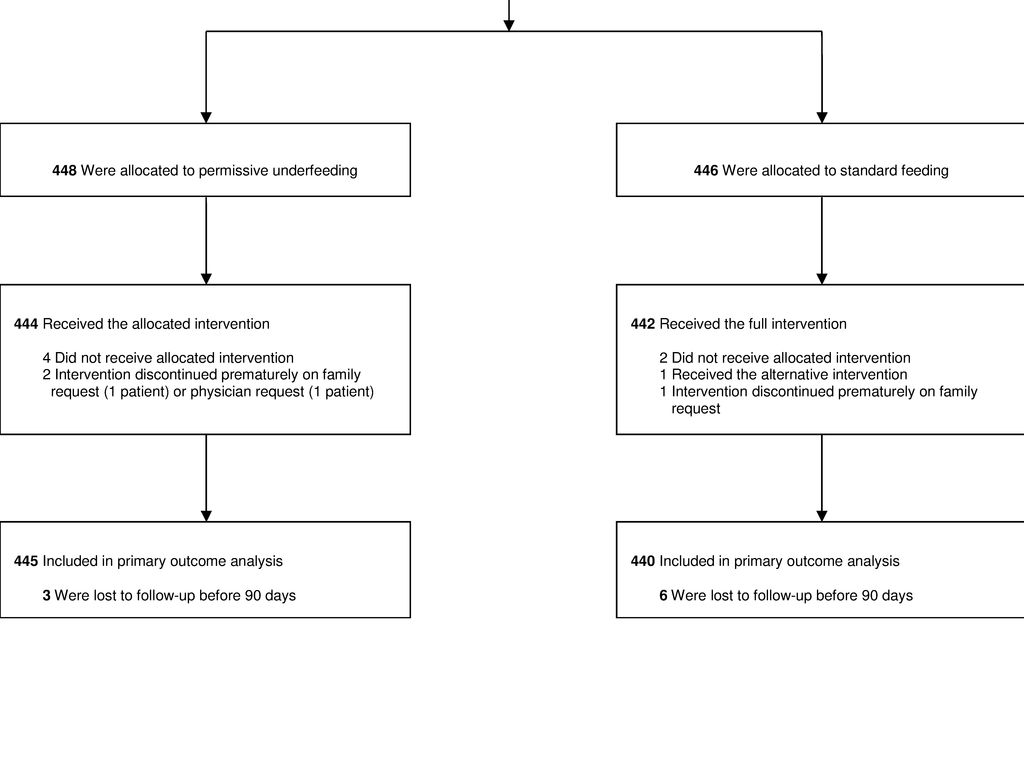
Comparison - Randomization
文書による説明と同意 封筒で分類 unblinded pragmatic randomized unblinded, pragmatic, randomized

25
Intervention 標準量(70-100%)を投与する群 減量(40-60%)して投与する群
BEE, Resting Metabolic Rate, IJEE で必要カロリー量を算出 標準量(70-100%)を投与する群 減量(40-60%)して投与する群 タンパク投与量は両群同じ (1.2〜1.5g/kg/day) 介入は14日目まで(ICU退室、死亡、経口摂取の開始が可能となれば、中止) 使用した栄養剤は Abbott社、Nestle社製 (COI無し) ワークショップ、ロールプレイなど
を投与する群. 減量(40-60%)して投与する群. タンパク投与量は両群同じ. (1.2〜1.5g/kg/day) 介入は14日目まで(ICU退室、死亡、経口摂取の開始が可能となれば、中止) 使用した栄養剤は. Abbott社、Nestle社製 (COI無し) ワークショップ、ロールプレイなど.")
26
目標カロリーの計算方法 ワークショップ、ロールプレイなど EDEN trialでは、非蛋白カロリーとして25-30kcal/day、蛋白投与量を1.2〜1.6g/kgとして算出している →目標カロリーの計算方法が以前の研究とは異なる

27
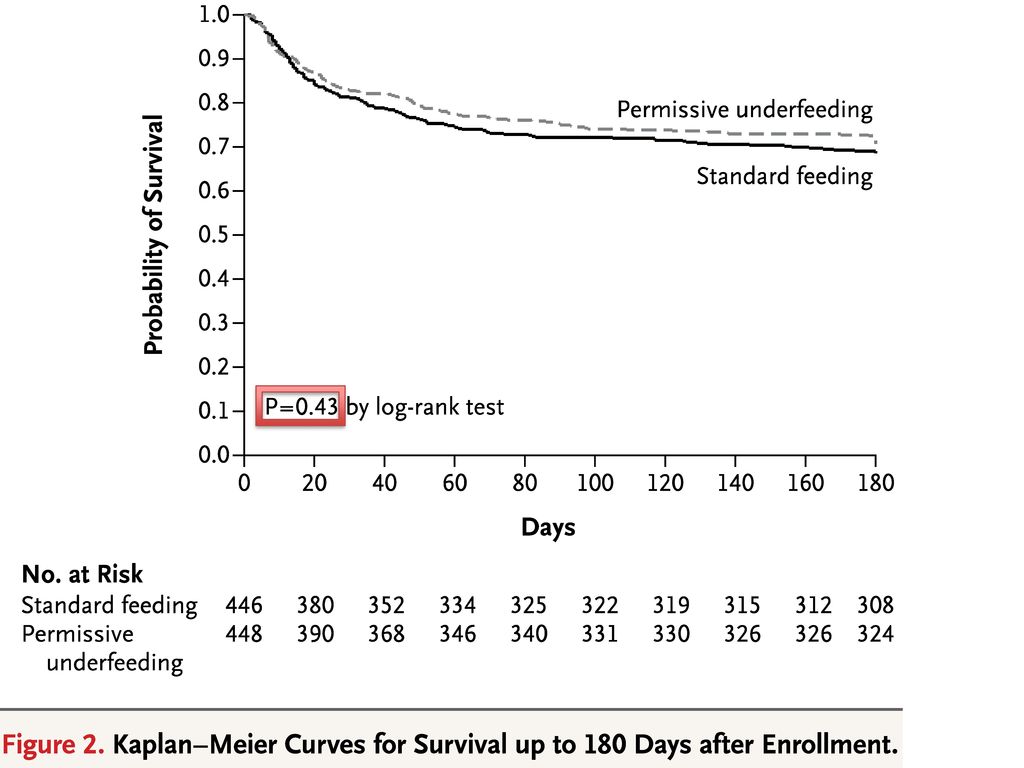
90日死亡率 Outcome ICUでの死亡率 28日死亡率 180日死亡率 SOFAスコア 人工呼吸器離脱期間 非ICU期間
入院期間 低血糖 低K, Mg, P 等 Serious Adverse Events (SAEs) we did not have a formal adjudication process for the secondary outcome of infections.
 we did not have a formal adjudication process for the secondary outcome of infections.")
28
Sample size 先行研究より、標準治療群の90日死亡率を25%、介入により8%の死亡率の改善が見込まれると予想 上記で、80% powerで計算し、それぞれの群で432名の患者が必要と算出した chi-square tests (for sex, age distribution, race or ethnic group, serious adverse events, hospital admission, emergency department read- mission, sensitivity, and specificity) Fisher’s ex- act test (for high-risk diagnoses with complications and related serious adverse events), Kruskal–Wallis test (for pain score, radiation ex- posure, and emergency department length of stay) SAS software, version 9.4
 Fisher’s ex- act test (for high-risk diagnoses with complications and related serious adverse events), Kruskal–Wallis test (for pain score, radiation ex- posure, and emergency department length of stay) SAS software, version 9.4.")
29
Analysis the investigators designed, managed, and analyzed the study independently chi-square test Cox proportional-hazards analysis SAS software, version 9.2 (SAS Institute) chi-square tests (for sex, age distribution, race or ethnic group, serious adverse events, hospital admission, emergency department read- mission, sensitivity, and specificity) Fisher’s ex- act test (for high-risk diagnoses with complications and related serious adverse events), Kruskal–Wallis test (for pain score, radiation ex- posure, and emergency department length of stay) SAS software, version 9.4
 chi-square tests (for sex, age distribution, race or ethnic group, serious adverse events, hospital admission, emergency department read- mission, sensitivity, and specificity) Fisher’s ex- act test (for high-risk diagnoses with complications and related serious adverse events), Kruskal–Wallis test (for pain score, radiation ex- posure, and emergency department length of stay) SAS software, version 9.4.")
30
Result

31
患者群に有意差なし 内科疾患が多い 重症敗血症は3割くらい
* Plus–minus values are means ±SD. There were no significant between-group differences. Data on laboratory values were not available for some patients; the numbers of patients with available data in the permissive-underfeeding group and the standard-feeding group, respectively, were as follows: glycated hemoglobin, 268 patients and 284 patients; C-reactive protein, 357 patients and 360 patients; triglycerides, 375 patients and 376 patients; total cholesterol, 373 pa- tients and 372 patients; low-density lipoprotein, 366 patients and 363 patients; high-density lipoprotein, 374 patients and 375 patients; prealbumin, 334 patients and 341 patients; transferrin, 359 patients and 361 patients; and 24-hour urinary nitrogen excretion, 305 patients and 292 patients. † The body-mass index is the weight in kilograms divided by the square of the height in meters. ‡ Scores on the Acute Physiology and Chronic Health Evaluation (APACHE) II range from 0 to 71, with higher scores indicating more severe disease. § Scores on the Sequential Organ Failure Assessment (SOFA) range from 0 to 24, with higher scores indicating a greater degree of organ failure. Table S6: Additional baseline characteristics. 患者群に有意差なし 内科疾患が多い 重症敗血症は3割くらい
 II range from 0 to 71, with higher scores indicating more severe disease. § Scores on the Sequential Organ Failure Assessment (SOFA) range from 0 to 24, with higher scores indicating a greater degree of organ failure. Table S6: Additional baseline characteristics. 患者群に有意差なし. 内科疾患が多い. 重症敗血症は3割くらい.")
32
Plus–minus values are means ±SD
* Plus–minus values are means ±SD. There were no significant between-group differences. Data on laboratory values were not available for some patients; the numbers of patients with available data in the permissive-underfeeding group and the standard-feeding group, respectively, were as follows: glycated hemoglobin, 268 patients and 284 patients; C-reactive protein, 357 patients and 360 patients; triglycerides, 375 patients and 376 patients; total cholesterol, 373 pa- tients and 372 patients; low-density lipoprotein, 366 patients and 363 patients; high-density lipoprotein, 374 patients and 375 patients; prealbumin, 334 patients and 341 patients; transferrin, 359 patients and 361 patients; and 24-hour urinary nitrogen excretion, 305 patients and 292 patients. † The body-mass index is the weight in kilograms divided by the square of the height in meters. ‡ Scores on the Acute Physiology and Chronic Health Evaluation (APACHE) II range from 0 to 71, with higher scores indicating more severe disease. § Scores on the Sequential Organ Failure Assessment (SOFA) range from 0 to 24, with higher scores indicating a greater degree of organ failure. Table S6: Additional baseline characteristics. ほぼ全員が人工呼吸器管理
 II range from 0 to 71, with higher scores indicating more severe disease. § Scores on the Sequential Organ Failure Assessment (SOFA) range from 0 to 24, with higher scores indicating a greater degree of organ failure. Table S6: Additional baseline characteristics. ほぼ全員が人工呼吸器管理.")
33
実際の投与カロリーは、介入群が目標量の46%、標準群が70%程度という結果 タンパク質の投与量は同等で、70%程度
* Plus–minus values are means ±SD. To convert values for blood glucose to milligrams per deciliter, divide by † P values were calculated with the use of the Wilcoxon–Mann–Whitney test. ‡ P values were calculated with the use of the independent Student’s t-test. § Information on formulas with a specific disease indication and those without a specific disease indication is provided in Tables S3 and S7 in the Supplementary Appendix. ¶Prokinetics included metoclopramide, erythromycin, domperidone, and any combination of these. 実際の投与カロリーは、介入群が目標量の46%、標準群が70%程度という結果 タンパク質の投与量は同等で、70%程度

34
Plus–minus values are means ±SD
* Plus–minus values are means ±SD. To convert values for blood glucose to milligrams per deciliter, divide by † P values were calculated with the use of the Wilcoxon–Mann–Whitney test. ‡ P values were calculated with the use of the independent Student’s t-test. § Information on formulas with a specific disease indication and those without a specific disease indication is provided in Tables S3 and S7 in the Supplementary Appendix. ¶Prokinetics included metoclopramide, erythromycin, domperidone, and any combination of these. 水分バランスに有意差あり

35
Figure 1 . Serial Measurements of the Intervention, Cointerventions, and Selected Outcomes in the Permissive-Underfeeding and Standard-Feeding Groups. The values shown are means; I bars indicate 95% confidence intervals. Asterisks denote statistical significance, after Bonferroni correction, for the difference between the two groups on each day, with the use of the independent Stu- dent’s t-test (for daily caloric intake) and Wilcoxon–Mann–Whitney test (for all other variables). P values for the change over time for both groups combined and for the difference between the two groups over time were calculat- ed with the use of repeated-measures analysis of variance. Total scores on the Sequential Organ Failure Assessment (SOFA) range from 0 to 24, with higher scores indicating a greater degree of organ failure. Nitrogen balance was calculated as [total protein intake in grams ÷ 6.25] – [(urinary nitrogen excretion in millimoles ÷ 35.7) + 4 g]. To con- vert values for blood glucose to milligrams per deciliter, divide by
 and Wilcoxon–Mann–Whitney test (for all other variables). P values for the change over time for both groups combined and for the difference between the two groups over time were calculat- ed with the use of repeated-measures analysis of variance. Total scores on the Sequential Organ Failure Assessment (SOFA) range from 0 to 24, with higher scores indicating a greater degree of organ failure. Nitrogen balance was calculated as [total protein intake in grams ÷ 6.25] – [(urinary nitrogen excretion in millimoles ÷ 35.7) + 4 g]. To con- vert values for blood glucose to milligrams per deciliter, divide by")
36
Table 2.では水分量に有意差があったが、
Figure 1 . Serial Measurements of the Intervention, Cointerventions, and Selected Outcomes in the Permissive-Underfeeding and Standard-Feeding Groups. The values shown are means; I bars indicate 95% confidence intervals. Asterisks denote statistical significance, after Bonferroni correction, for the difference between the two groups on each day, with the use of the independent Stu- dent’s t-test (for daily caloric intake) and Wilcoxon–Mann–Whitney test (for all other variables). P values for the change over time for both groups combined and for the difference between the two groups over time were calculat- ed with the use of repeated-measures analysis of variance. Total scores on the Sequential Organ Failure Assessment (SOFA) range from 0 to 24, with higher scores indicating a greater degree of organ failure. Nitrogen balance was calculated as [total protein intake in grams ÷ 6.25] – [(urinary nitrogen excretion in millimoles ÷ 35.7) + 4 g]. To con- vert values for blood glucose to milligrams per deciliter, divide by Table 2.では水分量に有意差があったが、 経時的な変化は両群間に有意差無し
 and Wilcoxon–Mann–Whitney test (for all other variables). P values for the change over time for both groups combined and for the difference between the two groups over time were calculat- ed with the use of repeated-measures analysis of variance. Total scores on the Sequential Organ Failure Assessment (SOFA) range from 0 to 24, with higher scores indicating a greater degree of organ failure. Nitrogen balance was calculated as [total protein intake in grams ÷ 6.25] – [(urinary nitrogen excretion in millimoles ÷ 35.7) + 4 g]. To con- vert values for blood glucose to milligrams per deciliter, divide by Table 2.では水分量に有意差があったが、 経時的な変化は両群間に有意差無し.")
37
Figure 1 . Serial Measurements of the Intervention, Cointerventions, and Selected Outcomes in the Permissive-Underfeeding and Standard-Feeding Groups. The values shown are means; I bars indicate 95% confidence intervals. Asterisks denote statistical significance, after Bonferroni correction, for the difference between the two groups on each day, with the use of the independent Stu- dent’s t-test (for daily caloric intake) and Wilcoxon–Mann–Whitney test (for all other variables). P values for the change over time for both groups combined and for the difference between the two groups over time were calculat- ed with the use of repeated-measures analysis of variance. Total scores on the Sequential Organ Failure Assessment (SOFA) range from 0 to 24, with higher scores indicating a greater degree of organ failure. Nitrogen balance was calculated as [total protein intake in grams ÷ 6.25] – [(urinary nitrogen excretion in millimoles ÷ 35.7) + 4 g]. To con- vert values for blood glucose to milligrams per deciliter, divide by
 and Wilcoxon–Mann–Whitney test (for all other variables). P values for the change over time for both groups combined and for the difference between the two groups over time were calculat- ed with the use of repeated-measures analysis of variance. Total scores on the Sequential Organ Failure Assessment (SOFA) range from 0 to 24, with higher scores indicating a greater degree of organ failure. Nitrogen balance was calculated as [total protein intake in grams ÷ 6.25] – [(urinary nitrogen excretion in millimoles ÷ 35.7) + 4 g]. To con- vert values for blood glucose to milligrams per deciliter, divide by")
38
* The number of days free from mechanical ventilation and the number of intensive care unit (ICU)–free days were calculated for the first 90 study days and were considered to be 0 for patients who died on or before day 90. Hypoglycemia was defined as a blood glucose level of less than 2.2 mmol per liter (40 mg per deciliter), hypokalemia as a potassium level of less than 2.8 mmol per liter, hypomagnesemia as a magnesium level of less than 0.60 mmol per liter, and hypophosphatemia as a phosphate level of less than 0.70 mmol per liter. Feeding in- tolerance was defined as vomiting, abdominal distention, or a gastric residual volume of more than 200 ml. Diarrhea was defined as three or more loose or liquid stools per day for 2 consecutive days. † P values were calculated with the use of the Wilcoxon–Mann–Whitney test.

39
* The number of days free from mechanical ventilation and the number of intensive care unit (ICU)–free days were calculated for the first 90 study days and were considered to be 0 for patients who died on or before day 90. Hypoglycemia was defined as a blood glucose level of less than 2.2 mmol per liter (40 mg per deciliter), hypokalemia as a potassium level of less than 2.8 mmol per liter, hypomagnesemia as a magnesium level of less than 0.60 mmol per liter, and hypophosphatemia as a phosphate level of less than 0.70 mmol per liter. Feeding in- tolerance was defined as vomiting, abdominal distention, or a gastric residual volume of more than 200 ml. Diarrhea was defined as three or more loose or liquid stools per day for 2 consecutive days. † P values were calculated with the use of the Wilcoxon–Mann–Whitney test.

41
文献の批判的吟味

42
New Knowledgeか? 過去の同様のstudyと比較して 介入群の投与カロリーを減らした (14日目まで)
両群で蛋白投与は同等とした 生食等で水分量の差を埋めた 非タンパクではなく総カロリー量で計算

43
Selection Bias 症例の7割がサウジアラビアの1施設 結局14%しかincludeされなかった

44
Information Bias 各施設が独自のprotocolで 行っている 目標カロリーに到達しなかった 症例がある
介入がunblinded Participating centers used their own protocols to guide delivery of enteral feeding.

45
交絡因子 ICU使用中の他の薬剤 原疾患のコントロール

46
外的妥当性の評価 患者群は適切か 診断は同じように出来るか 介入は同じように出来るか 今回のアウトカムは妥当だったか 今後の治療に生かせるか
(明日から来る患者に適応できるか) 診断は同じように出来るか 介入は同じように出来るか 今回のアウトカムは妥当だったか 今後の治療に生かせるか 患者群は適切か(明日から来る患者に適応できるか) 診断は同じように出来るか 介入は同じように出来るか 今回のアウトカムは妥当だったか 今後の治療に生かせるか
 診断は同じように出来るか. 介入は同じように出来るか. 今回のアウトカムは妥当だったか. 今後の治療に生かせるか. 患者群は適切か(明日から来る患者に適応できるか) 診断は同じように出来るか. 介入は同じように出来るか. 今回のアウトカムは妥当だったか. 今後の治療に生かせるか.")
47
外的妥当性 明日から来る患者に適応できるか
当施設のICUには 内科疾患、外科疾患、外傷 問わず入室している

48
外的妥当性 診断は同じように出来るか できる

49
外的妥当性 介入は同じように出来るか できる カロリー量を計算して投与量を調節するだけ

50
外的妥当性 今回のアウトカムは妥当だったか
Infectionの基準が曖昧

51
14日間はtrophic feedingでもいいかも
外的妥当性 今後の治療に生かせるか 14日間はtrophic feedingでもいいかも

52
本論文でわかったこと ・十分な蛋白を投与していれば、14日間trophic feedingでも大丈夫(目標カロリーの40〜60%) (EPaNIC trialでは、8日目以降PNを加えてfull feedingとしていたが・・) ・どの程度の蛋白投与が必要なのかどうかは、依然として不明
 (EPaNIC trialでは、8日目以降PNを加えてfull feedingとしていたが・・) ・どの程度の蛋白投与が必要なのかどうかは、依然として不明")


>")


 2012/10/20 E07>")


とNon-RSIの比較検討:救急気道管理に関する多施設前向き観察研究Japanese Emergency Airway Network (JEAN study) 大久保雅史1)6) 萩原佑亮2)6) 長谷川耕平3)6) 千葉拓世4)6)渡瀬博子5)6)>")


