Download presentation
Presentation is loading. Please wait.

1
岩盤崩壊の観測手法 Monitoring method for rock slope failure

2
岩盤崩壊の特徴 Characteristics of rock slope failure
土石流、地滑り、がけ崩れに比べて発生頻度は低いが、甚大な災害となりうる The frequency of occurrence is less compared with debris flow, landslide and surface slope failure, but it may result in a heavy disaster. 前兆現象を認識しにくい場合も多い Not so easy to recognize the warning sign in many cases

3
岩盤崩壊の形態 Type of rock slope failure
崩落 Fall すべり Slide 転倒 Toppling 座屈 Buckling

4
研究の背景と目的 Background and purpose of the study
岩盤崩壊は大規模でハード対策は困難 Rock slope failure occurs at a large scale in many cases, and ‘hard’ mitigation measures are difficult. 当面はモニタリングで対応せざるを得ない Monitoring should be taken at present. 計測技術の向上と評価方法の開発が必要 Improvement of monitoring technique and development of estimation technique are necessary. - 岩盤斜面の観測データが不足 - Lack of monitoring data in actual rock slope to examine above problem 実際に岩盤斜面を計測 Monitoring of actual rock slope 豊浜トンネル岩盤崩落(1996年、日本) Large scale rock fall at Toyohama tunnel (in 1996, Japan)
 Large scale rock fall at Toyohama tunnel. (in 1996, Japan)")
5
岩盤崩壊モニタリング実施個所位置図 Location map of monitoring site for rock slope failure

6
Tiltmeter 計器の設置事例(天鳥橋西地区)Example of instruments installed on the rock slope (Amadoribashi-nishi monitoring site) Crack gauge Extensometer 伸縮計 Extensometer 亀裂変位計 Crack gauge 傾斜計 Tiltmeter 鋼尺 Steel scale AEセンサー AE (acoustic emission) sensor デジタルカメラ(画像計測) Digital camera (image measurement) 監視カメラ Monitor camera 温度計 Thermometer 雨量計 Rain gauge etc. AE sensor Steel scale
 sensor. デジタルカメラ(画像計測) Digital camera (image measurement) 監視カメラ Monitor camera. 温度計 Thermometer. 雨量計 Rain gauge etc. AE sensor. Steel scale.")
7
周期的な変動特性 Cyclic fluctuation of data
伸縮計、亀裂変位計、傾斜計 Extensometer, Crack gauge, Tiltmeter 周期的な変動 Cyclic fluctuation 日変動、年変動 1 day cycle, 1 year cycle 温度との相関性 Correlative with temperature 岩盤崩壊に関係する累積変位を周期的変動と区別して検出する必要があるIt is necessary to detect accumulative movement related with failure distinctly from cyclic fluctuation. 夏 Summer Spring 年間の最大値 計測値 春 秋 Spring 春 Autumn Winter 年周期変動 冬 年間変動幅 Fluctuation range of 1 year cycle 年間の最小値 時間 7月 拡大 1月 1日の最大値 1日の最小値 1日 1日の変動幅 Fluctuation range of 1 day cycle 日周期変動 計測値の周期的変動の模式図 Schematic figure of cyclic fluctuation of data

8
計測値の地区別年変動幅 fluctuation range of 1 year cycle in each site
Extensometer Crack gauge Tiltmeter Fluctuation range of 1 year cycle:extensometer and crack gauge (mm) Fluctuation range of 1 year cycle:tiltmeter (degree) (Yasosuke site) Hokkaido (Babame site) Tohoku (Umijiri site) Kanto (Ousaka site) Hokuriku (Amadori-bashi nishi site) Kinki (Shimomyo site) Shikoku (Amagase site) Kyushu
 Fluctuation range of 1 year cycle:tiltmeter (degree) (Yasosuke site) Hokkaido. (Babame site) Tohoku. (Umijiri site) Kanto. (Ousaka site) Hokuriku. (Amadori-bashi nishi site) Kinki. (Shimomyo site) Shikoku. (Amagase site) Kyushu.")
9
Nov. 19, 1998 画像解析(固定されたデジタルカメラで撮影)
Image measurement (taken using fixed digital camera) Nov. 19, 1998
 Nov. 19,")
10
Nov. 19, 1998

11
Jan. 21, 1999

12
Feb. 18, 1999

13
Feb. 28, 1999

14
2時期の画像の重ね合わせ(1998年11月19日及び1999年2月18日)
Overlapping of 2 images taken in different time (Nov.11, 1998 and Feb.18, 1999)
")
15
2時期の画像の重ね合わせ(1998年11月19日及び1999年2月18日)
Overlapping of 2 images taken in different time (Nov.11, 1998 and Feb.18, 1999)
")
16
岩盤ブロック縁のトレース Tracing lines of edges of rock blocks
(Pixels) Extensometer S-1 Extensometer S-5 岩盤ブロック縁のトレース Tracing lines of edges of rock blocks (Pixels)
 Extensometer S-1. Extensometer S-5. 岩盤ブロック縁のトレース Tracing lines of edges of rock blocks. (Pixels)")
17
Displacement (Pixels) Displacement (mm)
Extensometer S-5 Extensometer S-1 各計測点の移動量 Displacement of each point
![]()
18
Number of AE event per minute
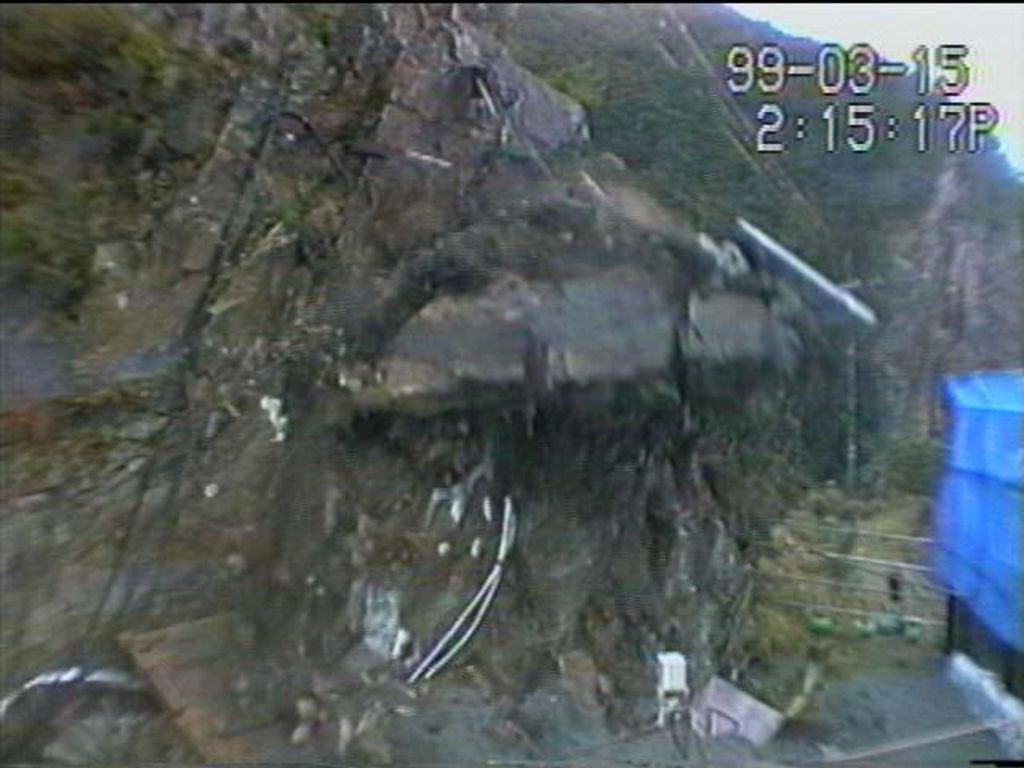
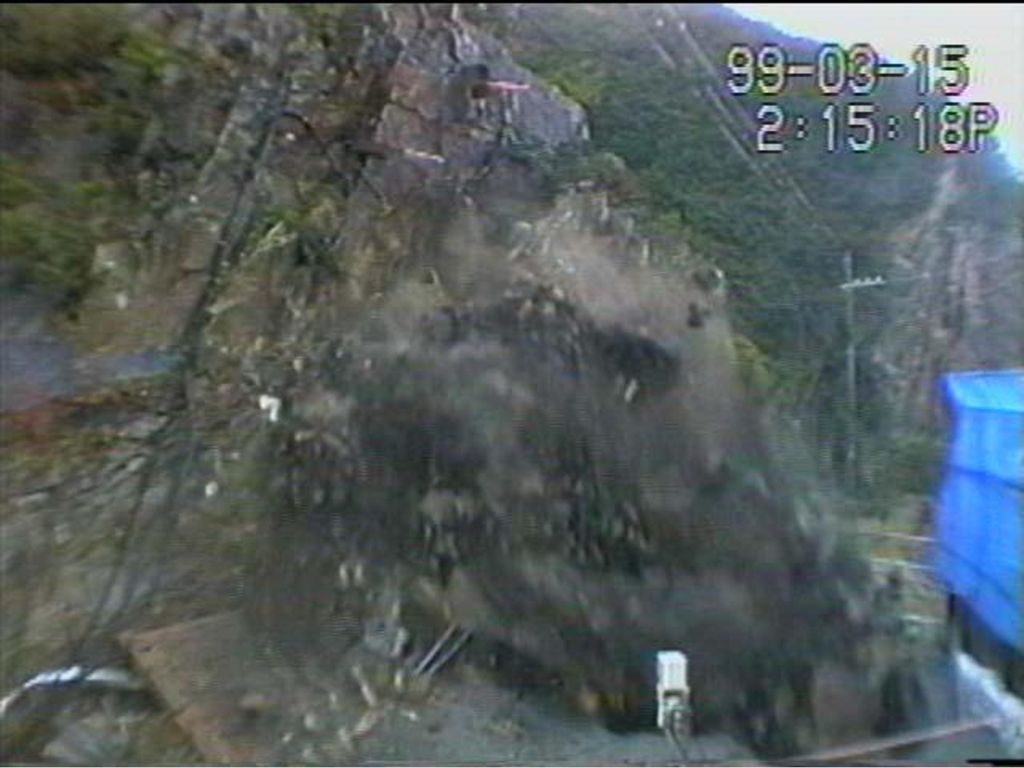
Number of accumulative AE event 崩壊時のAEセンサーデータ AE sensor data at the rock slope failure (March 15, 1999) AE:Acoustic emission (Elastic wave generated by the micro-scale internal destruction in the rock body)
 AE:Acoustic emission (Elastic wave generated by the micro-scale internal destruction in the rock body)")
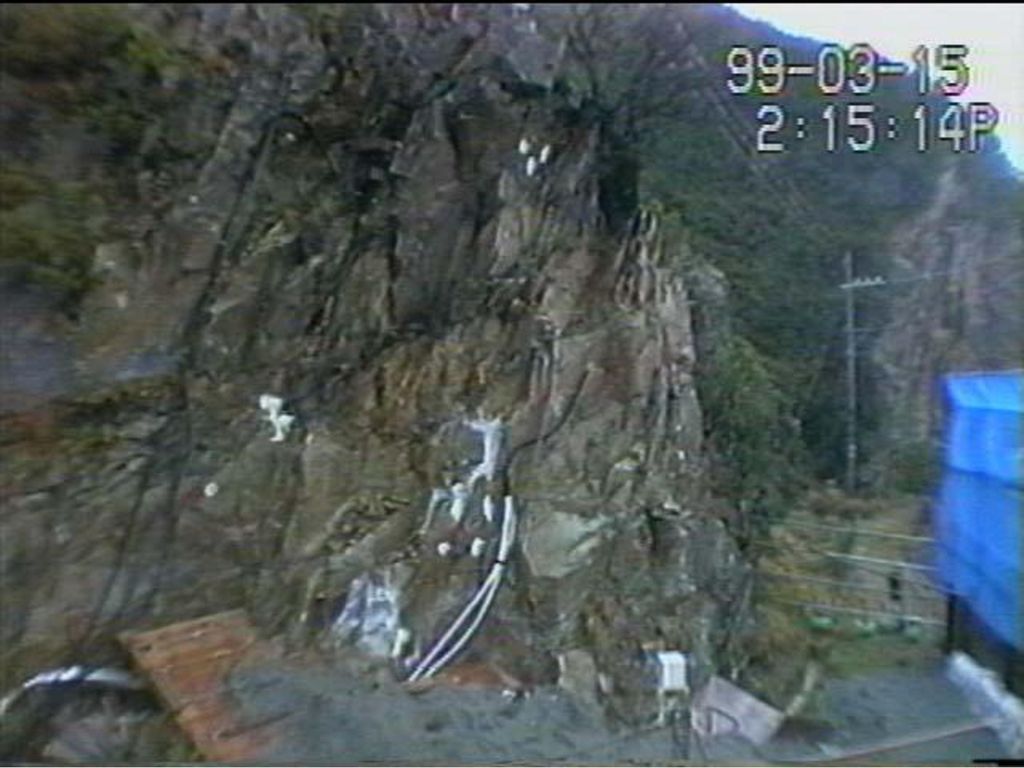
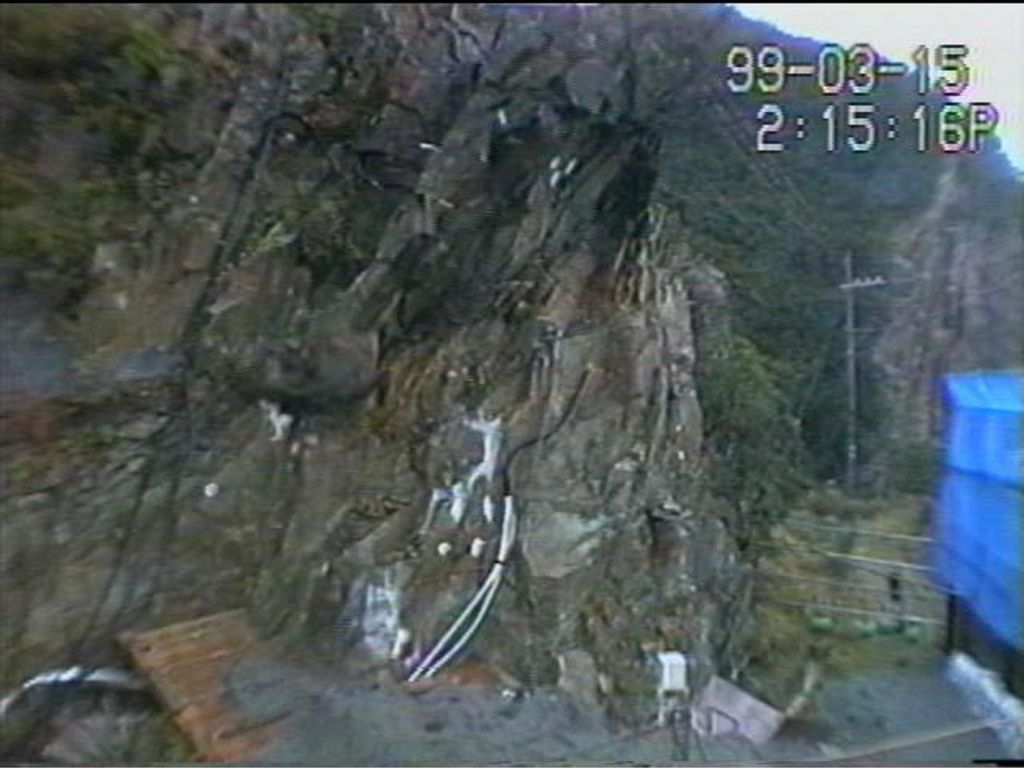
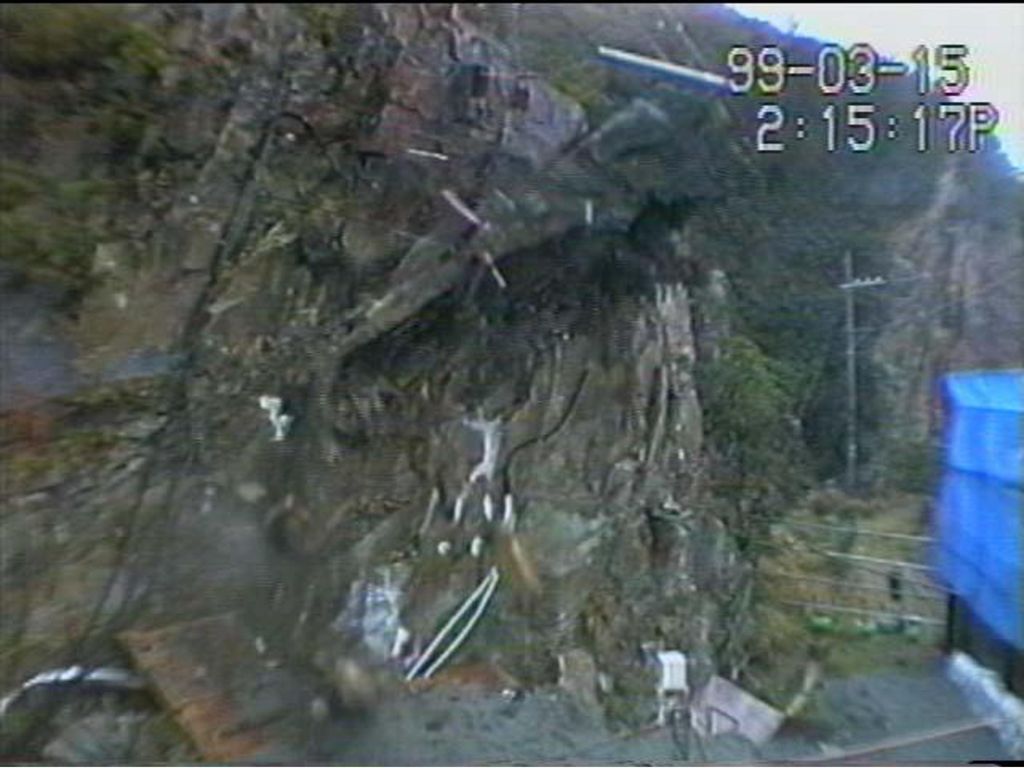
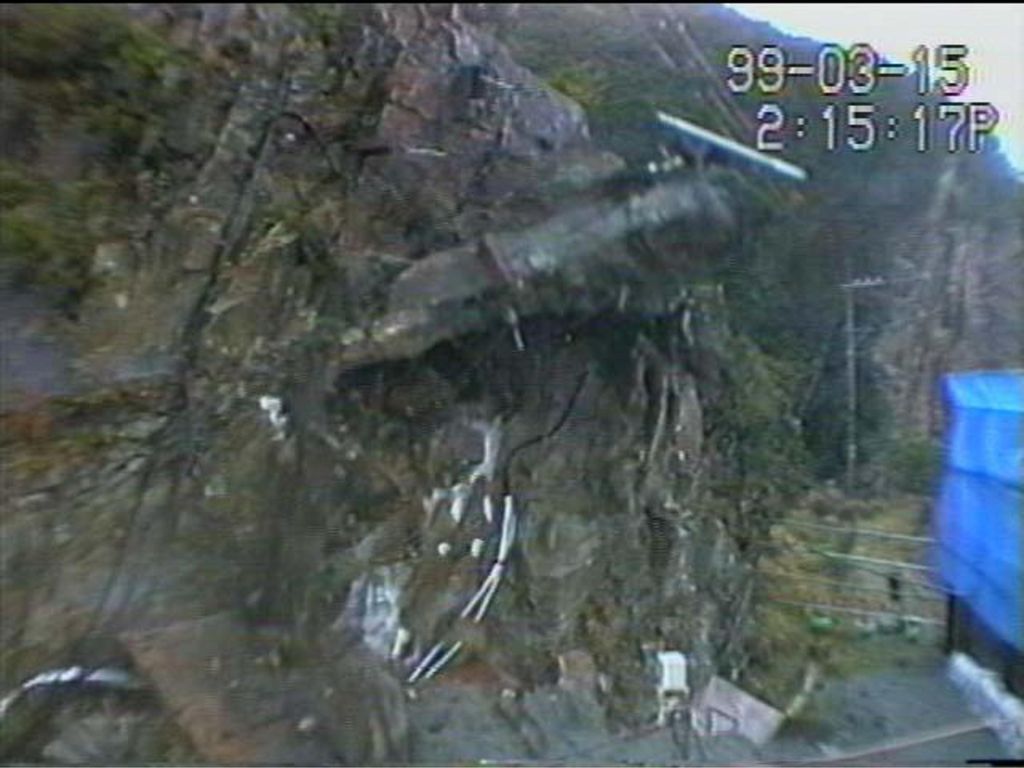
19
転倒崩壊の事例(天鳥橋西地区) Example of toppling failure (Amadoribashi-nishi site)
 Example of toppling failure (Amadoribashi-nishi site)")
26
Accumulative displacement graph (Amadoribashi-nishi site)
A3 block failure A2 block failure Accumulative displacement graph (Amadoribashi-nishi site) 地盤伸縮計・地盤傾斜計累積変位 Accumulative displacement: Extensometer and tiltmeter A2 block Extensometer S-5 Accumulative displacement (mm) Accumulative tilt (minute) A2小崩壊 A3 block Tiltmeter K-1 A3 block Extensometer S-1 日雨量 Daily rainfall Daily rainfall (mm)
 地盤伸縮計・地盤傾斜計累積変位. Accumulative displacement: Extensometer and tiltmeter. A2 block. Extensometer S-5. Accumulative displacement (mm) Accumulative tilt (minute) A2小崩壊. A3 block. Tiltmeter K-1. A3 block Extensometer S-1. 日雨量. Daily rainfall. Daily rainfall (mm)")
27
Accumulative displacement graph (Amadoribashi-nishi site)
A3 block failure A2 block failure Accumulative displacement graph (Amadoribashi-nishi site) 地盤伸縮計・地盤傾斜計累積変位 Accumulative displacement: Extensometer and tiltmeter A2 block Extensometer S-5 Accumulative displacement (mm) Accumulative tilt (minute) A2小崩壊 A3 block Tiltmeter K-1 A3 block Extensometer S-1 日雨量 Daily rainfall Daily rainfall (mm)
 地盤伸縮計・地盤傾斜計累積変位. Accumulative displacement: Extensometer and tiltmeter. A2 block. Extensometer S-5. Accumulative displacement (mm) Accumulative tilt (minute) A2小崩壊. A3 block. Tiltmeter K-1. A3 block Extensometer S-1. 日雨量. Daily rainfall. Daily rainfall (mm)")
28
Accumulative displacement graph of A2 block (Extensometer SL-5)
A2ブロック累積変位(地盤伸縮計SL-5) Accumulative displacement graph of A2 block (Extensometer SL-5) Fitting curve (Best-fit with hourly data) estimated at 2/27 0:00 Actual failure time Accumulative displacement (mm) Predicted failure time:2/27 11:00 (predicted at 2/27 0:00
 Accumulative displacement graph of A2 block (Extensometer SL-5) Fitting curve (Best-fit with hourly data) estimated at 2/27 0:00. Actual failure time. Accumulative displacement (mm) Predicted failure time:2/27 11:00 (predicted at 2/27 0:00.")
29
Example of gravity center Analysis (A2 block of
1999年11月 時点の形状 転倒予測位置の形状 Shape at predicted critical position of toppling Shape at Nov. 1999 転倒予測位置の重心 1999年11月 時点の重心 Gravity center at predicted critical position of toppling Gravity center at Nov. 1999 支点位置 Fulcrum 重心解析の例 (天鳥橋西地区A2ブロック、 側面図) Example of gravity center Analysis (A2 block of Amadoribashi-nishi site, Side view)
 Example of gravity center. Analysis (A2 block of. Amadoribashi-nishi site, Side view)")
Similar presentations

>")


>")


の検出と識別-2 呉海元@和歌山大学 2007年5月14日>")

 + Adjective Verb てform + いる間(に) during/while.>")
>")

