Download presentation
Presentation is loading. Please wait.

1
Japanese Social Security Present Situation and Problem
December 7, 2007 At Journal Club, Ministry of Public Health Yutaka Horie, MBA, PhD Chief Adviser for the Project

2
Social Security Expenditures
資料:国立社会保障・人口問題研究所「平成15年度社会保障給付費」、2006年度(予算ベース)は厚生労働省推計 (注1)図中の数値は、1950,1960,1970,1980,1990及び2003並びに2006年度(予算ベース)の社会保障給付費(兆円)である。 (注2)2006年度の「一人当たり社会保障給付費」は、給付費総額を平成18年1月1日時点(概算値)の人口総数で除したもの。
は厚生労働省推計. (注1)図中の数値は、1950,1960,1970,1980,1990及び2003並びに2006年度(予算ベース)の社会保障給付費(兆円)である。 (注2)2006年度の「一人当たり社会保障給付費」は、給付費総額を平成18年1月1日時点(概算値)の人口総数で除したもの。")
3
Structure of Social Security Budget for fiscal 2007
(regarding Ministry of Health, Labour and Welfare) Employment 221.3(\ mil.) (1.1%) Welfare 3.337(\ tri.) (15.9%) Healthcare 8.4285(\ tri.) (40.2%) Elderly Care 1.9,85(\ tri.) (9.3%) Pension 7.0305(\ tri.) (33.5%)
 Employment (\ mil.) (1.1%) Welfare (\ tri.) (15.9%) Healthcare (\ tri.) (40.2%) Elderly Care. 1.9,85(\ tri.) (9.3%) Pension (\ tri.) (33.5%)")
4
Strength and Weakness of Long-term Care (Services)
Full-line Services in Facility Care and Home Care : > to Shift from Hospital Stay to Social Service > to Shift from Facility Care to Home Care Universal System : Covering All Elderly People in Pension, Health Care and Long-term Care > Long-term Care Insurance (2000) widened the Choice of the Elderly
 widened. the Choice of the Elderly.")
5
Strength and Weakness of Long-term Care (Finance)
Social Security (Pension, Health Care and Long-term Care) is the Central Issue considering Sustainability of Finance : > Raising Consumption Tax (Currently 5 %) ? > Changing to Social Security Tax ? > Continuous Request to Reduce Expenditure Need to Rationalize \22 billion annually in Social security to Regain Primary Balance in early 2010’s
 is the Central Issue considering Sustainability of Finance : > Raising Consumption Tax (Currently 5 %) > Changing to Social Security Tax > Continuous Request to Reduce Expenditure. Need to Rationalize \22 billion annually in Social security to Regain Primary Balance in early 2010’s.")
6
ライフサイクルの変化についての説明 最新版がないかどうか?

8
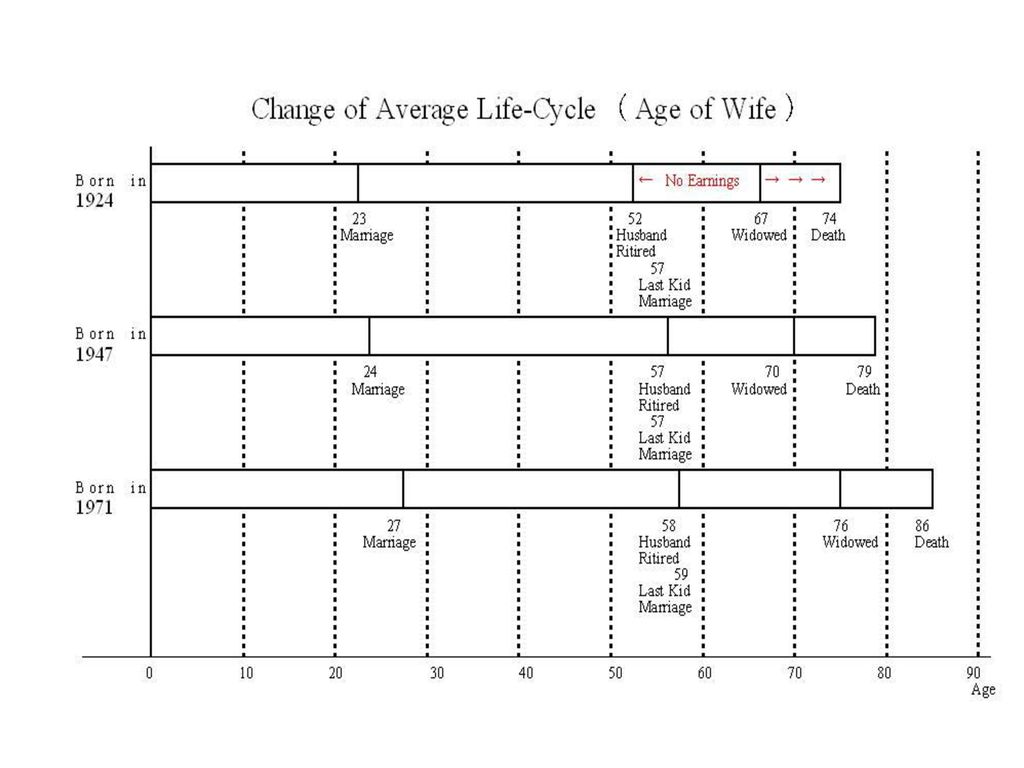
Change of Life Cycle Age of Marriage Getting Higher
Number of Child-birth Declining Life Expectancy Getting Longer Retirement Age Getting Higher Increase of Elderly Couple Alone and Elderly Living Alone 構造的な変化を説明

9
Population Structure(2005,2030,2055) estimated 2006 (medium)
Total Population 127.7million 115.2mil. 89.9mil. 75~ 11.6( 9%) 75~ 22.7(20%) 75~ 23.9(27%) 65~74 14.1(11%) 65~74 14.0(12%) 65~74 12.6(14%) 20~64 77.8(61%) 20~64 63.1(55%) 20~64 42.9(48%) Born After 2007 Depending on future births 注目したいのは、前期高齢者の数は余り変わらず、後期高齢者が増えて、現役が少なくなること。 Born after 2007 ~19 24.2(19%) ~19 15.5(13%) ~19 10.7(12%) Depending on future births 10, 000 10,000 10,000 Aged 65 over Aged 20~64 1person 3.0per. 1 1.7 1 1.2
 75~ 22.7(20%) 75~ 23.9(27%) 65~ (11%) 65~ (12%) 65~ (14%) 20~ (61%) 20~ (55%) 20~ (48%) Born. After Depending on future births. 注目したいのは、前期高齢者の数は余り変わらず、後期高齢者が増えて、現役が少なくなること。 Born after ~ (19%) ~ (13%) ~ (12%) Depending on future births. 10, , ,000. Aged 65 over. Aged 20~64. 1person. 3.0per. 1. 1.7. 1. 1.2.")
10
Trend of deaths No use

11
No use

12
Trend of Medical Expenditures
(%) (\ tri.) Ratio of Medical Expenditures over NI (%) 31.1 31.5 32.1 29.6 30.7 31.0 30.1 28.5 28.9 27.0 25.8 Medical Expenditures(\ trillion) 16.0 Medical Expenditures for Aged 25.4% 31.6% 33.1% 34.2% 35.5% 36.8% 38.4% 37.2% 37.5% 37.9% 36.9% 36.1% 国民医療費の推移 医療費の NI 比率が9%程度。 老人医療費が36% The expansion of Medical Expenditures exceeds that of National Income.
 (\ tri.) Ratio of Medical Expenditures over NI (%) Medical Expenditures(\ trillion) Medical Expenditures for Aged. 25.4% 31.6% 33.1% 34.2% 35.5% 36.8% 38.4% 37.2% 37.5% 37.9% 36.9% 36.1% 国民医療費の推移. 医療費の NI 比率が9%程度。 老人医療費が36% The expansion of Medical Expenditures exceeds that of National Income.")
13
International Comparison of Health Costs per Capita
of the Elderly over those of the non-Elderly (Total Health Costs of 65+ / Costs of 0-64) Japan (1997) 4.90 USA (1995) 4.60 UK (1997) 3.35 Germany (1994) 2.68 France (1991) 2.96 OECD HEALTH DATA (2002)
 Japan (1997) USA (1995) UK (1997) Germany (1994) France (1991) OECD HEALTH DATA (2002)")
14
We Need to Consider ・ Growing Number of the Elderly ・ Dementia
・ Improving “Quality of Services” ・ Combination of Self-help and Social Support

16
36.3 International Comparison of Medical Supply (2004) 14.2 14.3 2.0
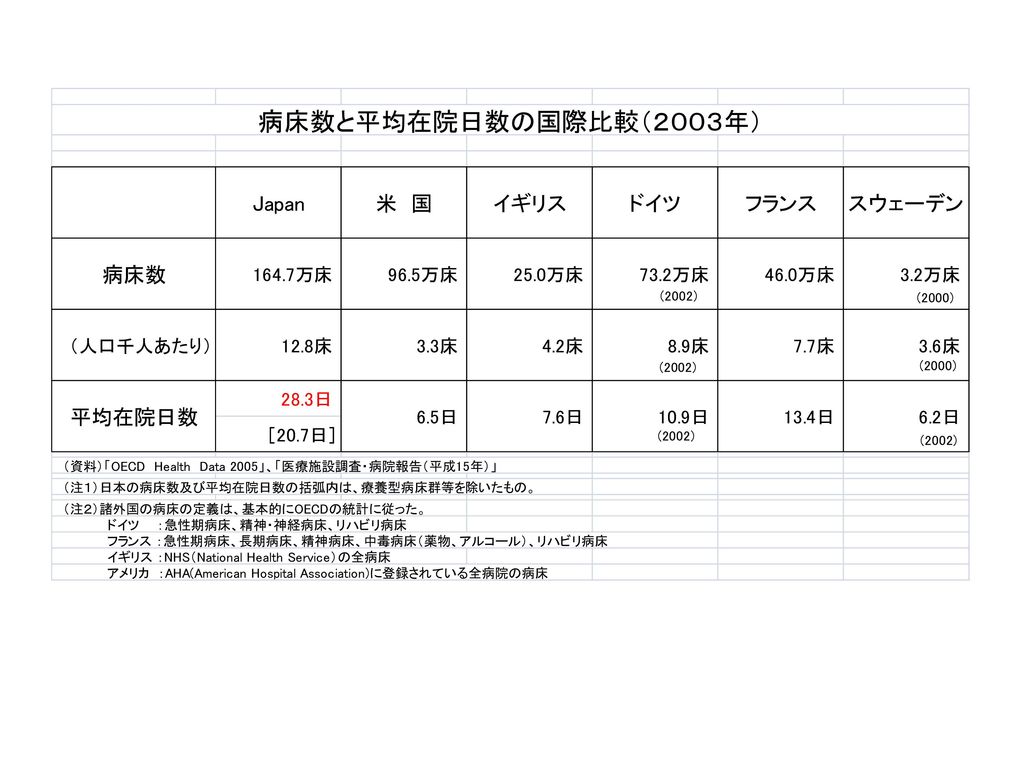
Country Avg. Length Hosp. Stay Beds/1,000people Doctors /100 Beds Doctors/ 1,000 people Nurses / 100 Beds Nurses/ Japan 36.3 14.2 14.3 2.0 63.2 9.0 Thailand 3.98 2.1 0.3 71.9 1.5 Germany 10.4 8.6 39.5 3.4 112.5 9.7 France 13.4 7.5 44.9 100.0 UK 7.2 4.0 57.0 2.3 226.8 9.2 USA 6.5 3.3 73.3 2.4 233.0 (2002) 7.9 (2002) (出典)「OECD Health Data 2006」 ※病床百床当たりの医師数、病床百床当たりの看護職員数については医師数、看護職員数を病床数で単純に割って百をかけた数値である。 ※平均在院日数の算定の対象病床はOECDの統計上、以下の範囲となっている。 日本:全病院の病床 ドイツ:急性期病床、精神病床、予防治療施設及びリハビリ施設の病床(ナーシングホームの病床を除く) フランス:急性期病床、長期病床、精神病床、その他の病床 イギリス:NHS(National Health Service:国民保健サービス)の全病床 アメリカ:AHA(American Hospital Association:米国病院協会)に登録されている全病院の病床 (長期病床を除く)
 7.9 (2002) (出典)「OECD Health Data 2006」 ※病床百床当たりの医師数、病床百床当たりの看護職員数については医師数、看護職員数を病床数で単純に割って百をかけた数値である。 ※平均在院日数の算定の対象病床はOECDの統計上、以下の範囲となっている。 日本:全病院の病床 ドイツ:急性期病床、精神病床、予防治療施設及びリハビリ施設の病床(ナーシングホームの病床を除く) フランス:急性期病床、長期病床、精神病床、その他の病床 イギリス:NHS(National Health Service:国民保健サービス)の全病床 アメリカ:AHA(American Hospital Association:米国病院協会)に登録されている全病院の病床 (長期病床を除く)")
17
Comparison of Length of Hospital Stay
1985 1990 1995 2002 Japan 54 51 44 38 USA 9 8 7 UK 16 10 Germany 17 14 11 France 18 15 13 出所:日本については、厚生労働省「病院報告」(平成15年)、その他各国はOECD Health Data 2005による。小数点以下四捨五入。 (注1)対象病床は以下の通り 日 本:全病院の病床 アメリカ:American Hospital Associationに登録されている全病院の病床 イギリス:NHSの全病床(長期病床は除く) ド イ ツ:急性期病床、精神病床、予防治療施設及びリハビリ施設の病床(ナーシングホームの病床を除く) フランス:急性期病床、長期病床、精神病床、その他の病床
、その他各国はOECD Health Data 2005による。小数点以下四捨五入。 (注1)対象病床は以下の通り. 日 本:全病院の病床. アメリカ:American Hospital Associationに登録されている全病院の病床 イギリス:NHSの全病床(長期病床は除く) ド イ ツ:急性期病床、精神病床、予防治療施設及びリハビリ施設の病床(ナーシングホームの病床を除く) フランス:急性期病床、長期病床、精神病床、その他の病床.")
18
Frequency of Consultations by Doctors per Outpatient Annually(2003)
Japan : (2002) USA : 8.9 UK : 5.2 Germany: (2000) France: 6.9 (2002) Sweden : (2001)
 USA : 8.9. UK : 5.2. Germany: 7.3 (2000) France: 6.9 (2002) Sweden : 2.9 (2001)")
19
Per capita health expenditure for the elderly by prefecture marks the highest in Fukuoka
\922 thousand and the lowest in Nagano \612 thousand with the difference of 1.5 folds.

20
介護保険制度の実施状況① 在宅 施設 2,358億円 262万人 (53%) (77%) 2,100億円 (47%) 80万人 (23%)
【介護保険の総費用と保険給付費の推移】 → 給付費は急速な伸び H12実績 H13実績 H14実績 H15実績 H16実績 H17予算 H18予算 総 費 用 3.6兆円 4.6兆円 5.2兆円 5.7兆円 6.1兆円 6.8兆円 7.1兆円 保険給付費 (対前年度増加率) 3.2兆円 4.1兆円 (16.0%増) 4.7兆円 (13.1%増) 5.1兆円 (8.5%増) 5.5兆円 (7.8%増) 6.0兆円 (9.1%増) 6.5兆円 (8.3%増) 利用者数 保険給付額 【1号保険料の推移】 262万人 (77%) 2,358億円 (53%) 第1期 (H12~14年度) 2,911円 在宅 第2期 (H15~17年度) 3,293円 (+13%) 2,100億円 (47%) 80万人 (23%) 第3期 (H18~20年度) 4,090円 (+24%) 施設 (出典:介護保険事業状況報告 2006年1月サービス分) ※全国平均(月額・加重平均)
 3.2兆円. 4.1兆円. (16.0%増) 4.7兆円. (13.1%増) 5.1兆円. (8.5%増) 5.5兆円. (7.8%増) 6.0兆円. (9.1%増) 6.5兆円. (8.3%増) 利用者数. 保険給付額. 【1号保険料の推移】 262万人. (77%) 2,358億円. (53%) 第1期. (H12~14年度) 2,911円. 在宅. 第2期. (H15~17年度) 3,293円. (+13%) 2,100億円. (47%) 80万人. (23%) 第3期. (H18~20年度) 4,090円. (+24%) 施設. (出典:介護保険事業状況報告 2006年1月サービス分) ※全国平均(月額・加重平均)")
21
Elderly People in Japan 2015
○ Accelerating the Aging In 2015, most Baby-Boomers enter into Aging generation 65+ and retire. (Peak of the Aging expected to be in 2025.) ○ 2.5 Million Dementia Elderly Anticipated Currently, about 1.5 Million are Dementia Elderly. ○ 5.7 Million Elderly Expected to Live Alone ○ “Housing “ Expected to be a Big Factor
 ○ 2.5 Million Dementia Elderly Anticipated. Currently, about 1.5 Million are Dementia Elderly. ○ 5.7 Million Elderly Expected to Live Alone. ○ Housing Expected to be a Big Factor.")
22
Change of Basic Principles on Elderly Care
○ Universal Services ・From Services for the Poor to Services for all the Elderly ○ From Municipalities Decisions to Contracts ・the Elderly able to Choose and Decide the contents of Care ○ Cost Payment ・From Free or Low Charge to 10% Charge of Consumed Services ○ Municipalities taking the Central Role for Elderly Care ○ Continuous Living at Home Considered to be Important ・Home Care rather than Facility Care ・Encouragement of Independent Living rather than Taking Care of Everything ・Local Services

23
Home Care Service Model
① Care + Prevention Preventive Activities like Exercise ② Care of the Dementia ③ Support for the Elderly Living Alone

24
Labour Force Women:Japan

25
Labour Force Women:Thailand

Similar presentations
 Defined Benefit Pension Plan 退職者医療保険(確定給付型) Postretirement Health Care Plan.>")
 日本合成化学健康保険組合 <一般勘定> ・収入 922百万円 ・支出 794百万円 収支差額 128百万円 経常収支 123百万円(対予算 +102 、対前年 +257 ) <介護勘定> ・収入 80百万円 ・支出 62百万円 収支差額 18百万円(対予算.>")

 ・たてがき / 縦書き (from right to.>")


>")

 in Dresden.>")
 Applied 294 Interviewed 88 Offered admission 53>")

 平成18年推計値 (日本の将来人口推計).>")